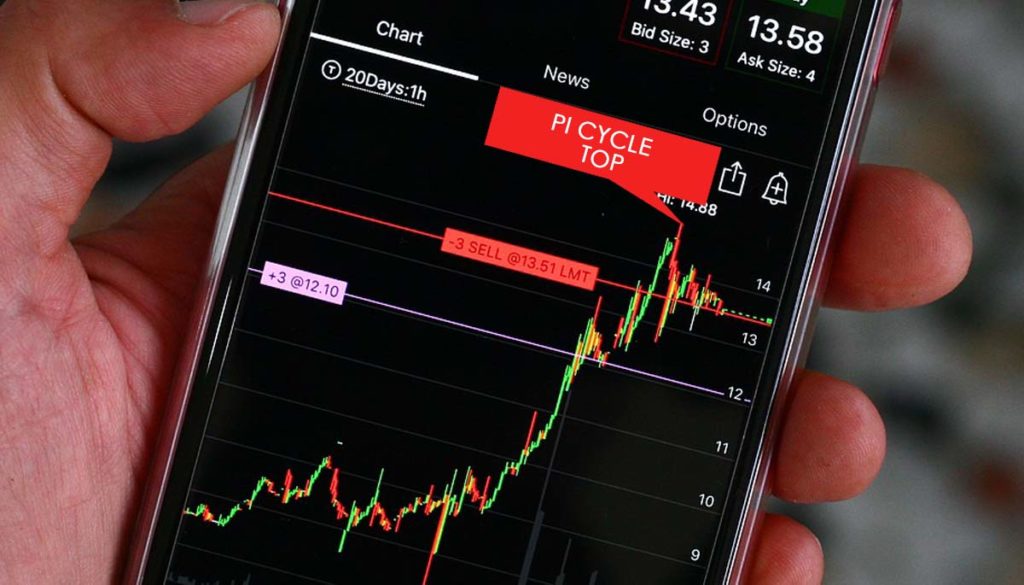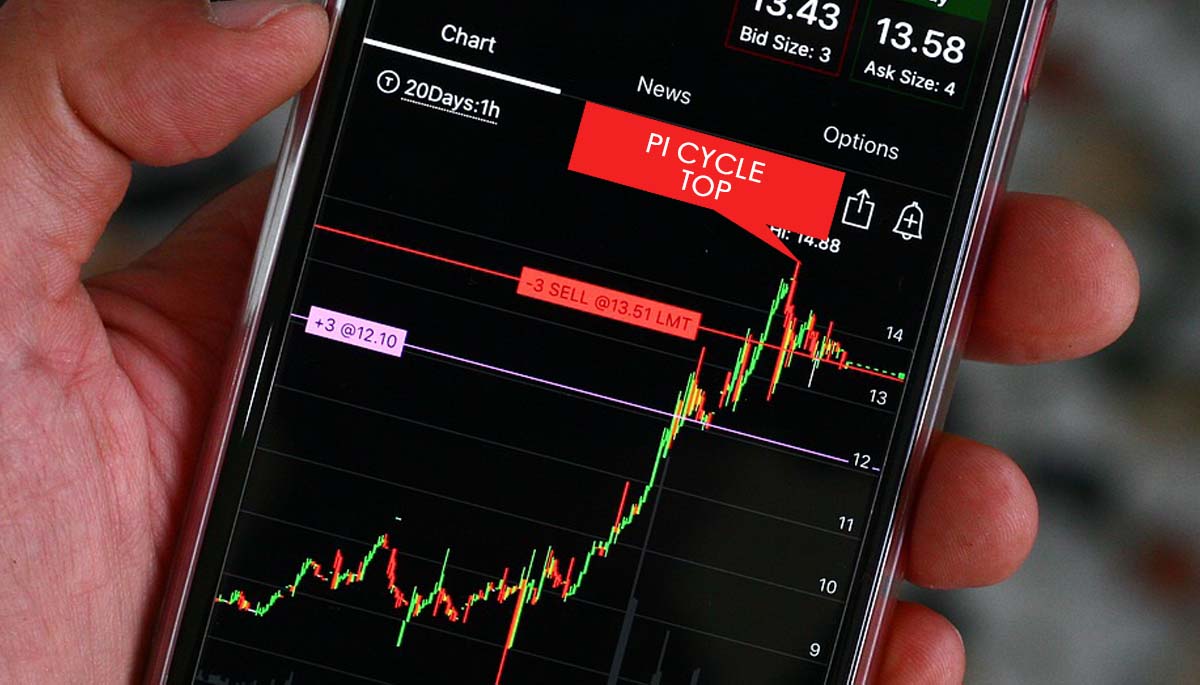
Pi Cycle Top Indicator is a signal indication chart graph that predicts market tops by using a 111-day moving average and a 2x multiple of 350-day moving average.
In the current times, there is a huge wave of cryptocurrencies which is taking place.
Every individual today is very much inclined towards cryptocurrencies, and Bitcoin being the hot favorite one. The reason behind is indeed, simple, and that is that Bitcoin is backed up by a solid technology of blockchain.
Bitcoin has increased by more than 500% in past few years. It was the last time BTCUSD drew close to challenging its 20-week moving average, which has historically been one of the most dependable measures of where the world’s most popular cryptocurrency is now in the market cycle.

Pi Cycle Top Indicator
For this particular bitcoin market cycle, an indicator built to accomplish the same has flashed a top signal. Pi Cycle Top Indicator is an indication that the top is in when the 111-day moving average crosses above the 2350-day moving average.
The graphic below shows the above-mentioned moving average crossovers across a daily BTCUSD chart dating back to 2013. The points where the two moving averages intersect are indicated by the vertical orange lines. They are within three days of bitcoin’s last three peaks. Each time, there was a 60-80% correction.
The first two peaks on the above chart are part of the same bitcoin cycle, given they happened in April and November of 2013. On November 28, 2012, Bitcoin’s first halving event had just occurred. The European debt crisis, notably the bail-in of Cypriot banks, was in full swing during that initial peak in April. The implosion of Mt. Gox is commemorated by the second peak.
Note that the signal still appears to work, despite the fact that the first peaks occurred in a different crypto market than the one we have today. Because there isn’t enough daily history to construct the 2350-day MA, it misses a previous cycle top (not seen in the above chart). The two moving averages crossed again this past weekend, as seen on the far right of the chart.
Back to the Moving Average of the Last 20 Weeks
The Pi Cycle Top Indicator is appealing; the moves on the weekly chart below are interesting as we have yet to revisit the 20-week MA since the price went parabolic in late October 2020, signaling the end of the previous bear market. Past bull markets used this level as a barometer of the rally’s health, taking profits down to it and then riding it up as support.
This was evident during the protracted rally from 2016 to 2017. Before rising to its then all-time high of roughly $20k, the price action retested that 20-week MA at least five times. The maneuver appears to be just getting started. Keep in mind that each week that passes without major consolidation causes the weekly MA to rise even higher, offering a greater cushion. It’s valued at even more than $40,000 today.
Conclusion:
The basic picture is similar to what we’re seeing in US stocks. Stocks are expensive, and we’re seeing a lot of technical divergences, but the bigger macro picture shows that they still have a ways to go, and no one is ready to name a top just yet.
Cryptocurrency prices are likewise supported by the same variables. Regardless of whether the Pi Cycle Top Indicator is correct or not, the 20-week MA is still a long way away, favoring additional upside for the time being.


